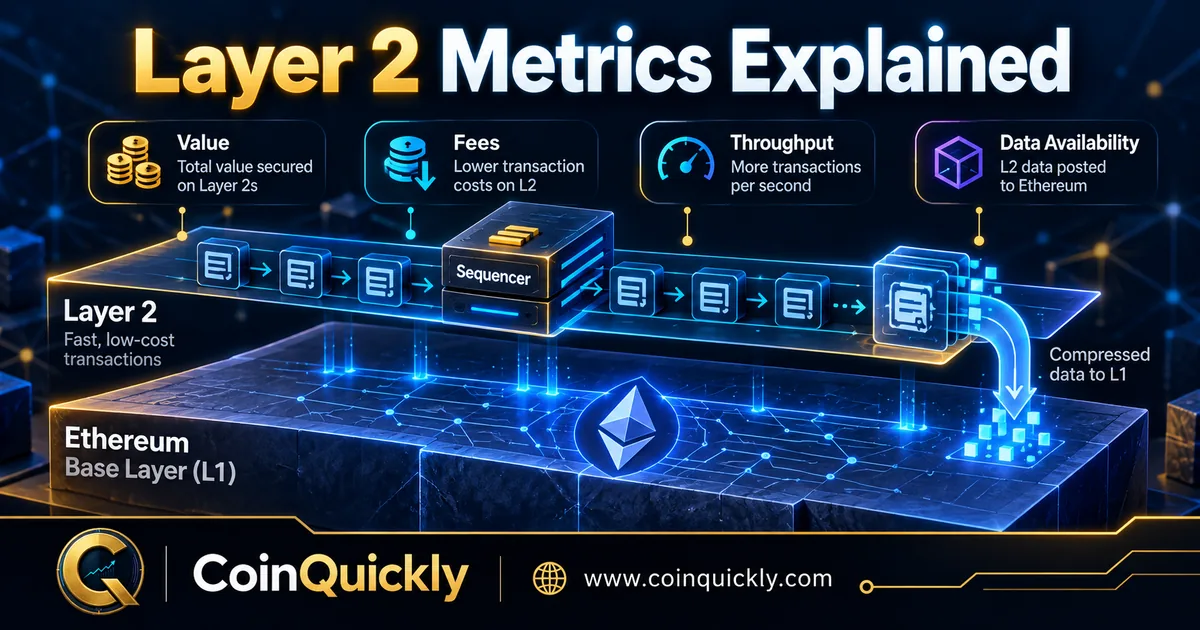
Layer 2 Metrics: TVL, Fees, Throughput & Security
Learn how to read Layer 2 value, fees, throughput, sequencer controls, and data availability together without mistaking activity for security or low fees for sustainability.
10 min readRead article →
 CoinQuickly
 journal
RSS FeedPractical crypto guides and considered analysis, built to stay useful after the headline moves on.
Learn how to read Layer 2 value, fees, throughput, sequencer controls, and data availability together without mistaking activity for security or low fees for sustainability.

Learn how to identify crypto market regimes using trend, participation, liquidity, and leverage—without claiming to know the next top or bottom.

Learn how interest rates influence Bitcoin through opportunity cost, financing, the dollar, and risk appetite—and why rate cuts do not guarantee crypto gains.
Learn what Bitcoin ETF inflows and outflows measure, how creations and redemptions work, and why flows differ from trading volume, AUM changes, and price predictions.

Learn how to measure crypto volatility, compare realized and implied volatility, calculate drawdowns, and assess liquidity, leverage, and tail risks beyond daily returns.
Learn how crypto exchange inflows, outflows, and netflows work, why wallet labels and exchange coverage matter, and how to separate transfers from trading signals.

Understand Bitcoin correlation with stocks, gold, the dollar, and interest rates, including return calculations, rolling windows, timing errors, and portfolio limits.

Evaluate blockchain activity using fees, address participation, successful transactions, and validator concentration, with a worked example and a practical verification framework.

Learn what DeFi TVL, fees, revenue, APR, and APY measure, how to reconcile them, and which protocol risks remain invisible on a dashboard.

Understand how crypto prices form through orders, liquidity pools, supply, demand, arbitrage, and leverage—and why market cap is not money flowing in.

Learn how to read active addresses, exchange flows, MVRV, and network activity, check their limitations, and combine them without turning metrics into price predictions.
Learn how to combine funding rates, open interest, price, and liquidation data without mistaking crowded positioning for a directional forecast.

Learn how crypto heatmap size, color, breadth, and sector patterns work—and why price performance alone does not prove capital flow.

Learn a repeatable way to evaluate crypto gainers and losers using timeframe, liquidity, volume, supply, market context, and catalysts—not price rank alone.
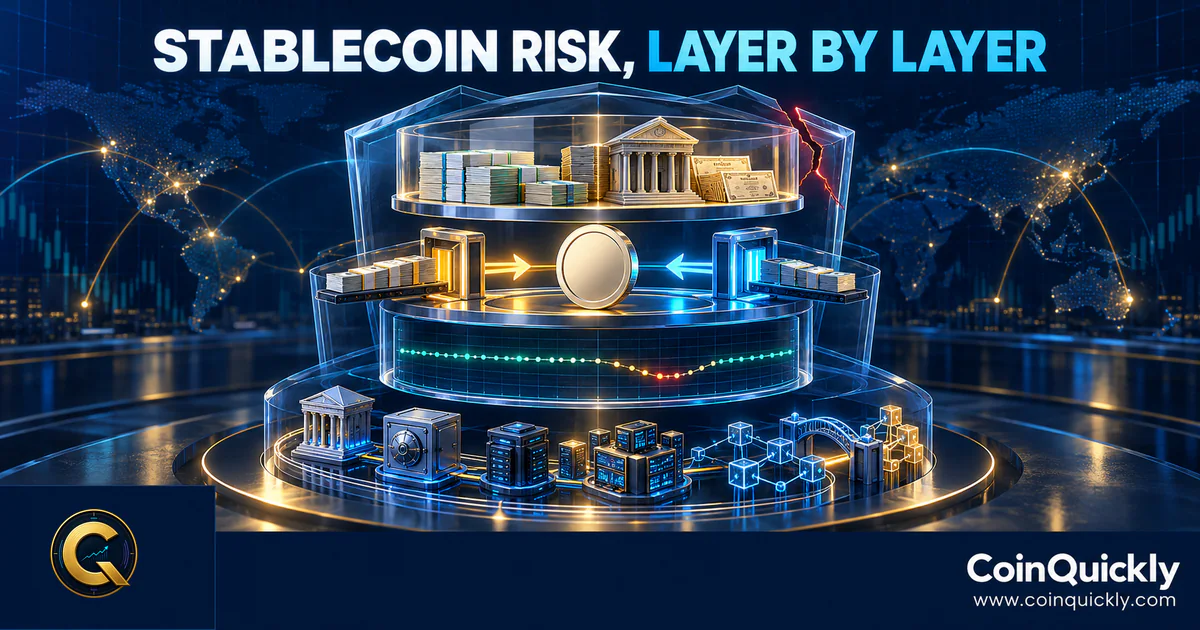
Learn how to evaluate stablecoin reserves, redemption rights, depeg severity, counterparties, and on-chain dependencies with a repeatable risk framework.

Learn what crypto proof of reserves can verify, what Merkle trees and wallet signatures miss, and how to evaluate a report without confusing it with an audit.
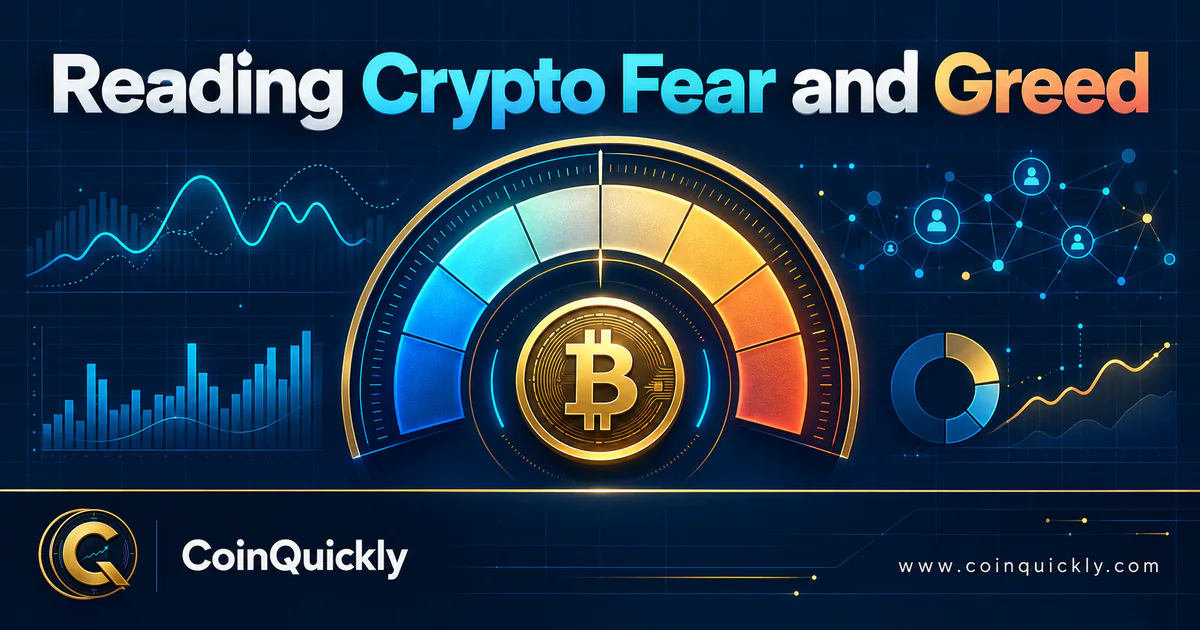
Learn how crypto Fear & Greed indexes combine market signals, why providers disagree, and what a sentiment score can—and cannot—tell you.

Learn how Bitcoin dominance is calculated, why providers can report different values, and what the metric can—and cannot—reveal about BTC and altcoins.

Learn how to analyze crypto tokenomics through supply, allocation, emissions, vesting, unlocks, dilution, and fully diluted valuation using a repeatable framework.
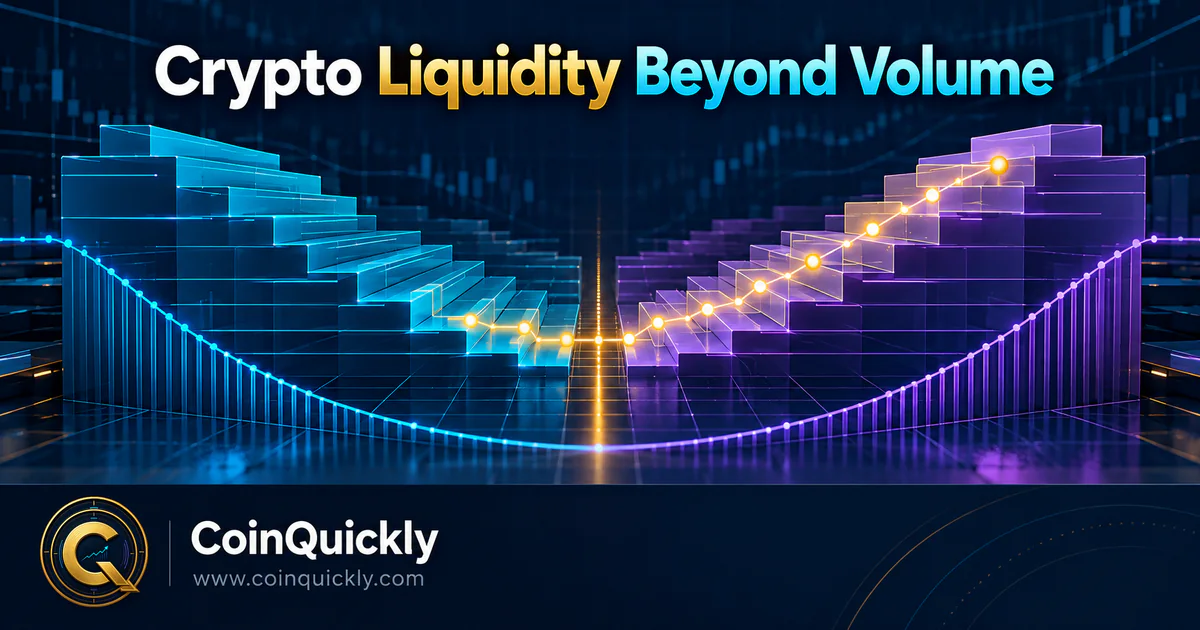
Learn how crypto liquidity works across volume, bid-ask spread, market depth, slippage, and market impact—and how to estimate execution quality before a trade.

Learn how to read crypto price, market cap, volume, supply, and liquidity together, verify the inputs, and spot what a market dashboard leaves out.