By the CoinQuickly Editorial Team
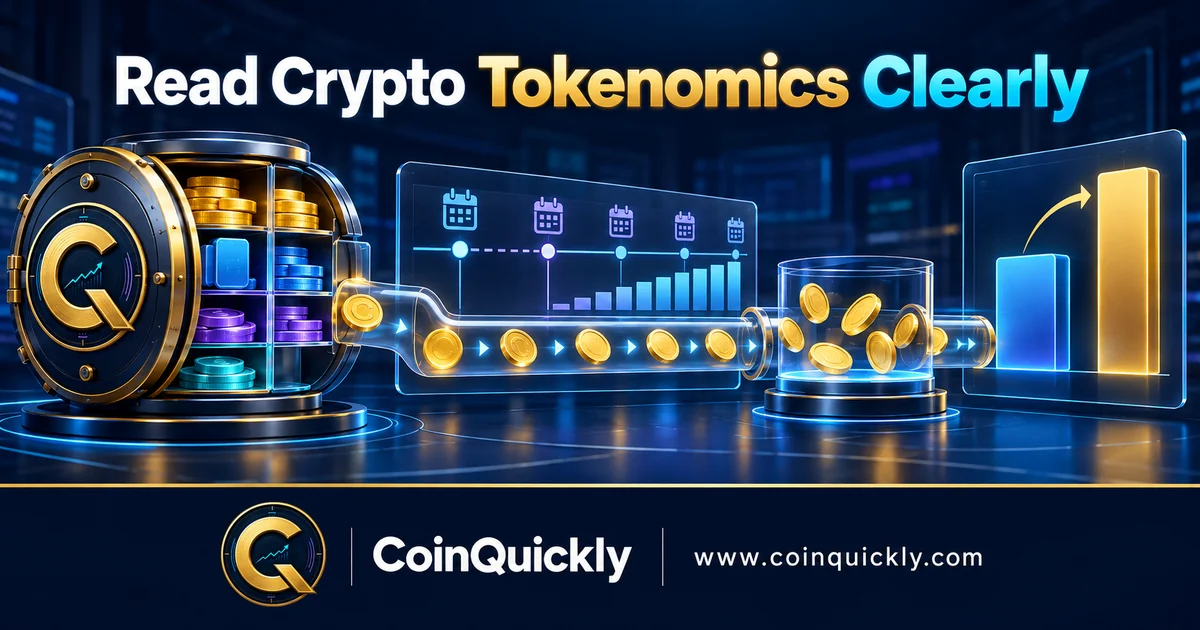
Crypto tokenomics explains how a token is created, allocated, released, used, and removed from supply over time. To read it well, separate the supply that exists today from the supply that can become liquid later, identify who receives new tokens, model when those tokens become available, and check whether demand and liquidity could plausibly absorb the change.
This guide turns tokenomics into a repeatable audit. It covers circulating, total, and maximum supply; emissions; vesting and unlocks; fully diluted valuation (FDV); and the contract or governance powers that can change the numbers.
🪙 Key Takeaways - Supply metrics are not interchangeable, and data providers may classify the same wallets differently. - Emissions create or distribute tokens under a policy; vesting controls when an allocation becomes available. One event can involve both, but they are not synonyms. - An unlock makes tokens transferable or claimable; it does not prove they entered circulating supply or were sold. - FDV is a constant-price valuation scenario, not a future market-cap forecast. - A useful tokenomics review combines supply growth, recipient concentration, liquidity, demand, and the authority to change the rules.
🧭 What does crypto tokenomics include?
Tokenomics is the economic design and operating policy of a crypto token. It covers the token’s supply rules, initial and continuing distribution, incentives, utility, value-capture mechanisms, governance rights, and the conditions under which units can be minted, unlocked, transferred, or burned.
A complete review asks five connected questions:
- How many tokens exist, and how many are considered circulating?
- Who controls the remaining supply?
- When and under what conditions can that supply become transferable?
- Why are new tokens issued, and what demand may absorb them?
- Who can change the supply policy, vesting contracts, treasury rules, or token utility?
Supply matters because a token price applies to a particular number of units. Distribution matters because two tokens with the same supply can have very different holder concentration and governance risk. Demand matters because lower issuance alone does not create adoption, revenue, or durable token use.
Key Insight: Read tokenomics as a system of stocks, flows, recipients, and rules. A static allocation pie chart answers only part of the question.
📊 How do circulating, total, and maximum supply differ?
Circulating supply estimates the units available to the public, total supply measures issued units net of recognized burns, and maximum supply estimates the upper limit under the current rules. The exact classifications can differ by provider, especially for treasury, foundation, insider, staked, bridged, or unlocked-but-unclaimed tokens.
| Supply measure | Practical question | Common limitation |
|---|---|---|
| Circulating supply | How many tokens does the provider consider part of the market float? | Requires judgment about excluded wallets and restrictions |
| Total supply | How many tokens have been issued and not recognized as burned? | Can include locked, treasury, or insider-held tokens |
| Maximum supply | What is the estimated ceiling under the current policy? | May be absent, changeable, or dependent on governance |
| Locked supply | How many tokens remain restricted by time, contract, or agreement? | Off-chain restrictions may be harder to verify |
| Unlocked supply | How many tokens have cleared their restrictions and can be claimed or transferred? | Unlocked does not necessarily mean claimed, circulating, or sold |
| Circulating percentage | What share of the selected full-supply denominator is circulating? | Depends on both the provider’s numerator and chosen denominator |
CoinMarketCap’s supply methodology, updated September 25, 2026, explicitly distinguishes circulating supply from unlocked supply and defines FDV using maximum supply. CoinGecko’s methodology describes circulating supply as total supply less identified locked balances, while a separate 2026 CoinGecko metric uses total supply for its displayed FDV definition. These are not merely wording differences; they can change the reported ratios.
For that reason, never copy a supply number without recording:
- The provider and retrieval time.
- The contract or native asset being measured.
- The provider’s definition.
- Which wallets or categories were excluded.
- Whether the denominator is total, maximum, or another projected supply.
- Whether bridged, wrapped, staked, burned, or unclaimed tokens receive special treatment.
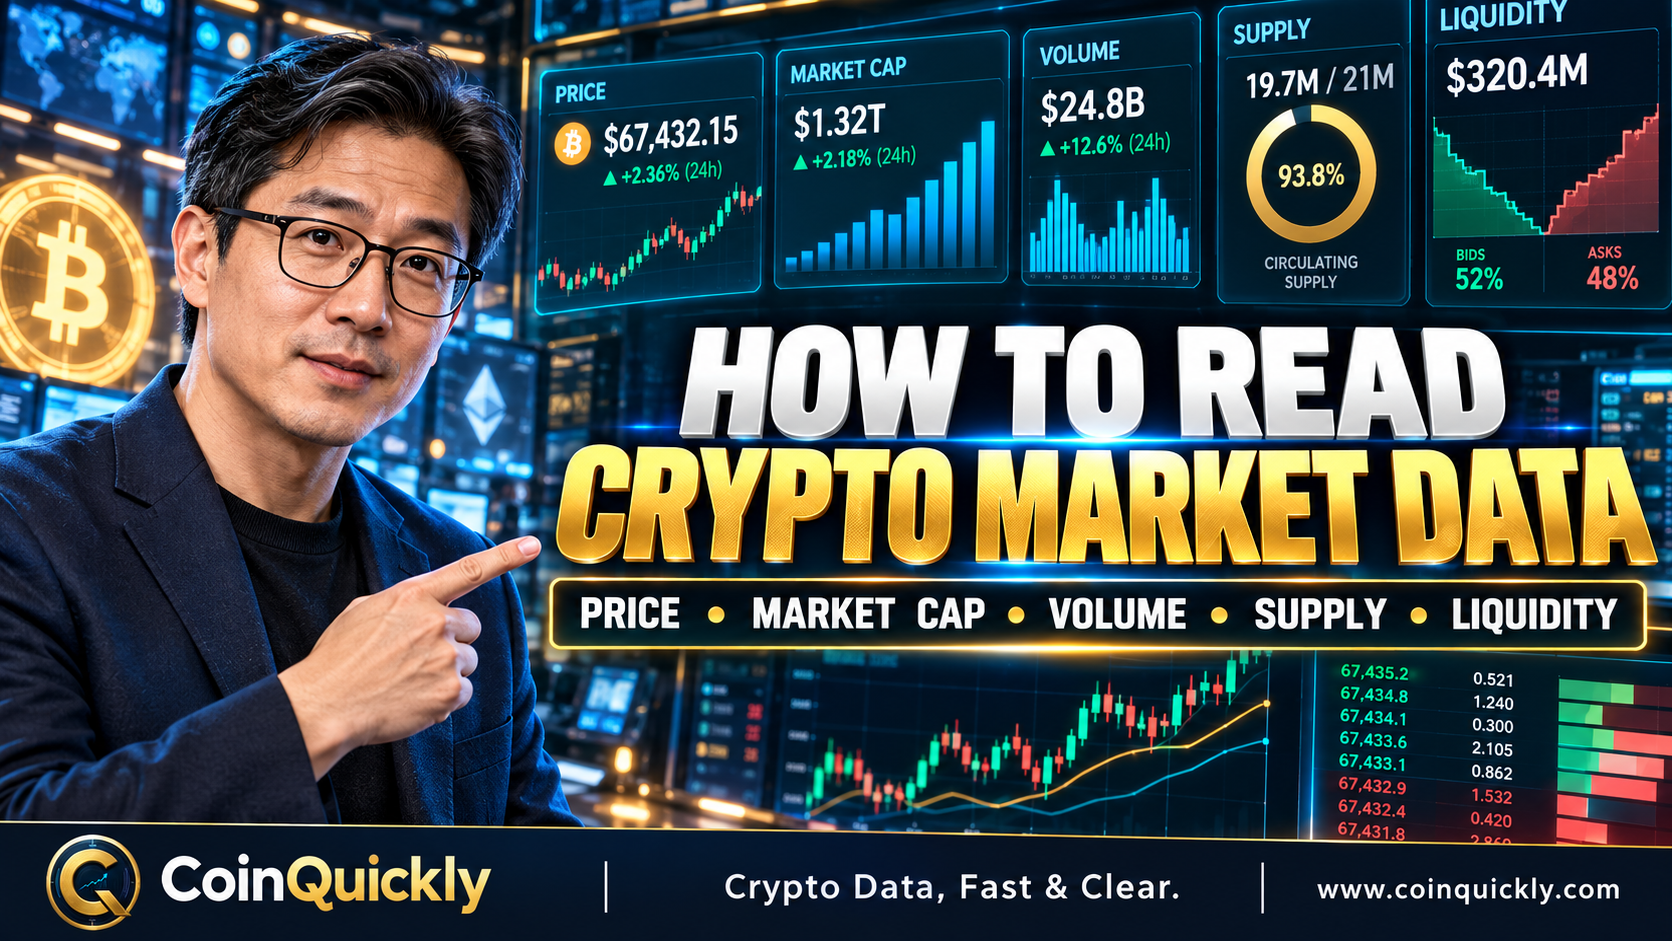
CoinQuickly’s guide to reading crypto market data explains how price, market cap, volume, supply, and liquidity fit together. Use one provider and one timestamp for comparisons, then reconcile important figures against project documentation and on-chain records.
Total supply is not necessarily a hard cap
For an ERC-20 token, a contract’s totalSupply value reports issued supply according to that implementation. It does not, by itself, prove that future minting is impossible. OpenZeppelin’s documentation shows that ERC-20 supply mechanisms can include fixed issuance, controlled minting, and burning.
Inspect the deployed contract and governance system for:
- Mint functions and authorized minter roles.
- Upgradeable proxy controls.
- Governance proposals that can change issuance.
- Emergency or administrative permissions.
- Burn mechanisms and whether burns are mandatory, discretionary, or activity-dependent.
- Cross-chain representations that could be mistaken for additional native supply.
“Maximum supply” is most meaningful when the limit is enforceable and changing it requires a transparent, difficult process. A number shown in a whitepaper is weaker evidence if privileged accounts can alter the policy unilaterally.
⛓️ What are token emissions, inflation, and burns?
Token emissions are units released under a schedule or mechanism, while inflation is the percentage growth of the relevant supply measure over a period. A burn removes recognized units from supply. The net change depends on both additions and removals.
Useful formulas include:
gross supply growth = new supply during period / starting supply × 100
net supply change = minted or released supply - recognized burns
net inflation rate = net supply change / starting supply × 100
The starting supply must be named. Ten million new tokens equal 10% growth against a 100 million circulating supply but only 1% against a 1 billion fully diluted supply.
Emissions may fund:
- Validator or miner rewards.
- Staking incentives.
- Liquidity incentives.
- Ecosystem grants and user rewards.
- Treasury operations.
- Contributor compensation.
Issuance is not automatically harmful. It may pay for network security or bootstrap participation. The analytical question is whether the reason, recipients, duration, and measurable benefits justify the dilution and whether the incentive persists after subsidies decline.
Official Ethereum documentation illustrates a dynamic system in which issuance adds ETH and fee burning removes ETH; the balance determines net supply change. Official Solana documentation illustrates scheduled inflation used primarily for staking rewards. These systems should not be reduced to one “fixed versus inflationary” label because their mechanisms, recipients, and governance differ.
⚠️ Risk Warning: A quoted staking yield is not automatically real economic return. If rewards are primarily paid through new token issuance, compare the holder’s reward rate with total supply growth, validator commission, lockups, liquidity, and token-price risk.
Burns need context
A burn can reduce supply, but its economic importance depends on scale, funding source, and counterfactual. Ask whether the burn is:
- Programmatic or discretionary.
- Funded by protocol usage, treasury assets, or new issuance elsewhere.
- Measured against circulating or total supply.
- Large enough to offset emissions over the same period.
- Permanent and verifiable on-chain.
A token can burn units while remaining net inflationary. A buyback can also move tokens into a treasury rather than destroy them. Do not infer price appreciation from the word “burn.”
🔐 How do allocations and vesting schedules work?
An allocation assigns portions of supply to stakeholder groups, while vesting sets the conditions under which those allocations become available. Common groups include the community, team, investors, foundation, treasury, ecosystem programs, liquidity providers, validators, and public-sale participants.
First check whether all allocation percentages total 100%. Then map each category to a recipient, legal or smart-contract restriction, starting date, cliff, release frequency, end date, and amendment authority.
| Vesting pattern | How it works | Main analytical question |
|---|---|---|
| Immediate release | Allocation is transferable at or near launch | How concentrated is the initial float? |
| Cliff | Nothing vests until a defined date, then a tranche becomes available | How large is the first release relative to current circulation and liquidity? |
| Linear vesting | Tokens become available continuously or in frequent increments | What is the monthly or annualized supply-growth rate? |
| Cliff plus linear | An initial tranche releases after a delay, followed by gradual vesting | Does the first cliff create a step change before smoother emissions? |
| Milestone-based | Release depends on performance, governance, or another condition | Who verifies the milestone, and can the condition change? |
| Discretionary or TBD | Timing depends on treasury, foundation, or governance action | What decision process, cap, notice period, and reporting apply? |
“Team and investors are vested for four years” is incomplete. It should specify when the clock starts, whether there is a cliff, how much releases at the cliff, whether vesting occurs daily or monthly afterward, and what happens if a contributor leaves or an agreement changes.
Official Optimism supply reporting provides a useful disclosure lesson: it separates circulating tokens from committed allocations that may still be subject to lockups, vesting, or milestones, and it warns that its circulating definition may differ from third-party definitions. The transferable analytical principle is to preserve intermediate states instead of forcing every token into “locked” or “circulating.”
🔓 What does a token unlock actually mean?
A token unlock removes a transfer or claim restriction from an allocation. It increases potential liquidity, but it does not establish that the beneficiary claimed the tokens, transferred them to an exchange, or sold them.
Keep these events separate:
- Minted: The token exists on-chain.
- Vested or unlocked: A restriction has expired or a condition has been met.
- Claimed: The beneficiary has withdrawn or received the allocation.
- Transferred: The tokens moved to another address.
- Classified as circulating: A data provider included them in its float estimate.
- Sold: A market transaction transferred economic exposure to a buyer.
Tokenomist’s methodology distinguishes scheduled unlocks from on-chain claims because project schedules can be off-chain commitments and actual withdrawals can occur at different times. This distinction prevents a common error: treating the entire scheduled tranche as immediate sell volume.
An unlock still matters because it expands the set of tokens that could move. Measure it from several angles:
unlock as % of current circulation = unlock amount / current circulating supply × 100
unlock as % of full supply = unlock amount / chosen full-supply denominator × 100
unlock value at reference price = unlock amount × timestamped token price
The dollar value is a valuation snapshot, not expected sale proceeds. To assess absorption risk, compare the potential flow with actual market depth, spread, reliable spot volume, venue concentration, derivatives positioning, and the recipient’s constraints. CoinQuickly’s guide to crypto liquidity beyond headline volume explains why a 24-hour volume figure is not the same as executable capacity.
How to Verify: Check the official schedule, vesting contract, beneficiary or distributor addresses, claim transactions, treasury reports, and data-provider methodology. Record which part is documented, which part is observed on-chain, and which part remains an estimate.
💹 What does fully diluted valuation mean?
Fully diluted valuation applies the current token price to a stated full-supply denominator. It asks what the token’s valuation would be at today’s unit price if that selected supply were counted. It does not predict that the future price will remain constant or that all tokens can be sold at that price.
The general formula is:
FDV = current token price × fully diluted supply used by the provider
For capped tokens, the denominator is often maximum supply. Some providers use total supply or a projected eventual supply, especially when a hard maximum is unavailable. Always state the denominator before comparing FDV figures.
Related measures include:
market cap = current price × circulating supply
circulating percentage = circulating supply / fully diluted supply × 100
FDV-to-market-cap ratio = fully diluted supply / circulating supply
If both valuations use the same price and consistent supplies, an FDV-to-market-cap ratio of 5 implies that the selected full supply is five times the reported circulating supply. It does not mean the price must fall 80%, that five times as much capital must enter, or that every non-circulating token will be sold.
FDV is most useful as a normalization tool and scenario input. It helps reveal low-float structures and supports comparisons when the same definitions are used. It is less informative when maximum supply is undefined, governance can change issuance, the unlock horizon is extremely long, or the current price comes from a thin market.
CoinQuickly analysis: a worked tokenomics example
CoinQuickly analysis shows how one hypothetical token can look modest by circulating market cap but much larger under a full-supply scenario. The example is educational, uses no live token, and assumes the stated schedule occurs exactly as written.
Assume Token A has:
| Input | Hypothetical value |
|---|---|
| Current price | $2.00 |
| Circulating supply | 200 million |
| Total minted supply | 600 million |
| Selected fully diluted supply | 1 billion |
| Scheduled vesting unlocks over next 12 months | 120 million |
| Scheduled network and user emissions over next 12 months | 30 million |
| Assumed recognized burns | 0 |
The current circulating market cap is:
$2.00 × 200 million = $400 million
The FDV is:
$2.00 × 1 billion = $2 billion
The circulating percentage is:
200 million / 1 billion × 100 = 20%
The FDV-to-market-cap ratio is:
$2 billion / $400 million = 5
Next, separate the one-year flows. Scheduled unlocks plus other emissions equal 150 million tokens. If every released token were classified as circulating and there were no burns, the upper-bound scenario would be:
projected circulating supply = 200 million + 120 million + 30 million = 350 million
gross circulating-supply growth = 150 million / 200 million × 100 = 75%
At an unchanged $2 price, the resulting circulating market cap would be $700 million. That is arithmetic, not evidence that $300 million of new capital entered the market.
A separate constant-market-cap scenario holds the $400 million valuation fixed:
implied price = $400 million / 350 million ≈ $1.14
That result is about 42.9% below the starting unit price. It is not a prediction. It isolates the mathematical effect of more circulating units while assuming the valuation remains unchanged. Real outcomes depend on demand, liquidity, holder behavior, protocol adoption, market conditions, burns, staking, and whether unlocked tokens are actually classified as circulating.
The strongest conclusion is limited but useful: Token A has a low initial float and a material scheduled supply increase relative to current circulation. The numbers justify deeper research; they do not produce a buy, sell, or price target.
How CoinQuickly analyzed this
This article uses a reproducible educational model rather than a live-token ranking or forecast. CoinQuickly reviewed the source ledger on October 6, 2026 and applied consistent definitions to one hypothetical scenario.
- Sources: Current CoinMarketCap and CoinGecko supply methodologies; official Ethereum and Solana issuance documentation; OpenZeppelin ERC-20 supply documentation; official Optimism supply reporting; and Tokenomist methodology for unlock and claim states.
- Metrics: Circulating, total, maximum or selected fully diluted supply; circulating percentage; market cap; FDV; FDV-to-market-cap ratio; scheduled unlocks; other emissions; burns; and one-year gross supply growth.
- Period: A hypothetical 12-month forward schedule. No historical price series or live market data is used.
- Method: Treat existing supply measures as stocks and scheduled unlocks, emissions, and burns as flows. Calculate an upper-bound circulation scenario and a separate constant-market-cap sensitivity case.
- Criteria: A useful tokenomics assessment must name its provider, timestamp, supply definitions, recipients, release conditions, administrative powers, demand mechanism, and liquidity context.
- Limitations: The example assumes the schedule is accurate and unchanged. It does not estimate claiming, selling, staking, demand, liquidity, taxes, legal restrictions, treasury discretion, governance changes, or price probability.
🔍 How can you audit a token’s tokenomics step by step?
A reliable tokenomics audit reconciles project disclosures, smart-contract state, on-chain activity, and third-party methodology before interpreting valuation. Use a fixed process so attractive charts or isolated ratios do not determine the conclusion.
- Identify the exact asset. Confirm the network, contract address, native or wrapped status, denomination, and any redenomination or migration.
- Freeze the observation. Record the date, time, price source, supply provider, units, and definitions.
- Reconcile supply. Compare circulating, total, maximum, locked, unlocked, and burned amounts. Explain differences instead of averaging them.
- Map allocation recipients. List community, investors, team, foundation, treasury, ecosystem, market makers, validators, and other buckets. Confirm that the allocation totals reconcile.
- Build the release calendar. For each bucket, record the starting date, cliff, cadence, amount, end date, milestone conditions, and authority to amend the schedule.
- Separate event states. Distinguish minting, vesting, unlocking, claiming, transferring, provider classification, and selling.
- Calculate comparable ratios. Measure circulation percentage, FDV-to-market-cap, monthly and annual supply growth, and each major unlock relative to current circulation.
- Inspect control and demand. Review mint, burn, pause, freeze, proxy, treasury, and governance powers. Then identify who needs the token and why demand might persist after incentives decline.
- Stress the assumptions. Test slower demand, faster treasury deployment, no discretionary burns, schedule changes, thinner liquidity, and different provider definitions.
For a wider review of smart-contract, governance, custody, counterparty, and operational failure modes, use CoinQuickly’s crypto risk-management and due-diligence framework.
A compact tokenomics worksheet
| Field | What to record |
|---|---|
| Asset identity | Network, contract, symbol, native or wrapped |
| Observation | Provider, URL in research notes, timestamp, currency |
| Supply stocks | Circulating, total, full-supply denominator, locked, unlocked |
| Flows | Monthly unlocks, other emissions, burns, treasury distributions |
| Allocation | Recipient, amount, percentage, cost basis if verifiable |
| Vesting | Start, cliff, frequency, duration, conditions, amendment authority |
| Valuation | Price, market cap, FDV, circulating percentage, denominator |
| Control | Minter, proxy admin, multisig, governance, emergency powers |
| Demand | Required use, fee payment, collateral, governance, value capture |
| Liquidity | Spread, depth, venue concentration, reliable spot volume |
| Limitations | Missing wallets, off-chain agreements, estimates, conflicting data |
⚠️ Which tokenomics warning signs deserve more research?
A warning sign is a reason to verify more evidence, not automatic proof that a token will fail. Several issues become more important when they occur together.
- Allocation percentages do not reconcile to the stated full supply.
- A large “community” or “ecosystem” bucket lacks eligibility, spending, or reporting rules.
- The schedule omits exact dates, amounts, cliffs, or recipient categories.
- Maximum supply is marketed as fixed even though privileged mint or upgrade powers remain.
- Circulating supply relies mainly on self-reported wallets that cannot be independently reconciled.
- A small float supports a high FDV while large releases occur before liquidity or adoption develops.
- Yield is mostly financed by issuance, but marketing presents the nominal rate without dilution.
- Burns are emphasized without comparing them with gross emissions.
- Unlock calendars show scheduled supply but do not distinguish unlocked, claimed, and circulating tokens.
- Treasury or market-maker arrangements are material but undisclosed or difficult to verify.
- Token “utility” creates activity but no clear reason for persistent token demand or value capture.
- Governance participation appears broad while voting power, delegation, multisig control, or upgrade authority remains concentrated.
Data disagreement is also a signal. It may reflect timing, methodology, bridging, burns, or a legitimate classification choice. If the difference is material and cannot be reconciled, lower the confidence of the analysis rather than selecting the more favorable number.
Frequently asked questions
Is a high FDV always bad?
No. A high FDV states a valuation under a selected supply denominator at the current price. Its relevance depends on circulation, release timing, demand, liquidity, growth, governance, and comparison set. It is a warning against ignoring future supply, not a standalone verdict.
Do token unlocks always cause the price to fall?
No. An unlock makes tokens available; it does not prove they will be claimed or sold. Price effects depend on anticipation, size relative to float and liquidity, recipient behavior, demand, market conditions, and whether the event was already reflected in price.
What is the difference between vesting and an unlock?
Vesting is the rule or process through which a recipient earns access to an allocation over time or after conditions are met. An unlock is a point or interval when some of that allocation becomes transferable or claimable. A vesting schedule can contain multiple unlocks.
Can a token have no maximum supply?
Yes. Some protocols use continuing issuance rather than a hard cap. Analyze the issuance formula, governance powers, recipient incentives, burn mechanisms, and net supply growth instead of treating the absence of a cap as a complete conclusion.
Why do websites report different circulating supply figures?
Providers may classify insider, treasury, foundation, staked, bridged, locked, unlocked, or inactive balances differently. They may also update at different times or rely on project-submitted addresses. Record the methodology and reconcile the largest excluded wallets.
Is market cap the amount of money invested in a token?
No. Market cap multiplies a reference price by circulating supply. It does not measure cumulative cash inflow or the amount that all holders could realize. Executable value depends on available liquidity and market impact.
The bottom line
Reading crypto tokenomics means tracing supply through time: what exists, what is restricted, what can be released, who receives it, and which rules can change. Circulating market cap describes one present-state valuation, while FDV describes a constant-price full-supply scenario. Neither can replace an unlock calendar, holder map, liquidity review, or demand analysis.
The most useful output is not a single “good” or “bad” label. It is a dated model with explicit definitions, a reconciled release schedule, scenario calculations, known control points, and clearly stated uncertainties. Update that model whenever governance, contracts, treasury policy, or the supply schedule changes.
Disclaimer: The content on this website is for informational and educational purposes only and does not constitute financial or investment advice. The cryptocurrency market involves a high level of risk. Always do your own research (DYOR) before making any decision.